Identify the most effective graphical elements to use in your presentation
In this step, decide what charts will provide the most convincing display of your quantitative evidence. Take your index cards from step 6, and on each card that represents quantitative data, draw a thumbnail sketch of which chart or graphic you will use to best present that data.
Then continue to step 8: Slide layout.
Resources
Use the chart chooser diagram to help you select your charts
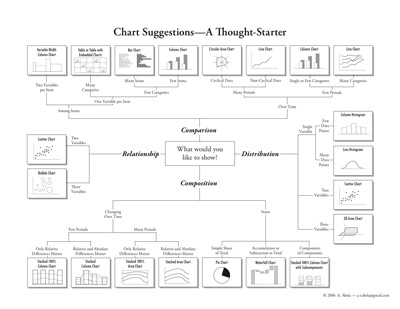
Download a pdf of the chart chooser.
See Juice Analytics’ online version of the chart chooser at www.ChartChooser.com.
See the chart chooser in Portuguese, Spanish, Japanese, and Chinese.
Compare different visualization taxonomies.
From Advanced Presentations by Design:
- What kinds of graphics should you use? (p. 97)
- Should you use clip art? (p. 98)
- What type fonts and sizes should you use? (p. 102)
- Should you use bullet-points? (p. 102)
- Should you use color? (p. 103)
- Should you use transitions or animations? (p. 104)